 |
| Source: David Stockman Email |
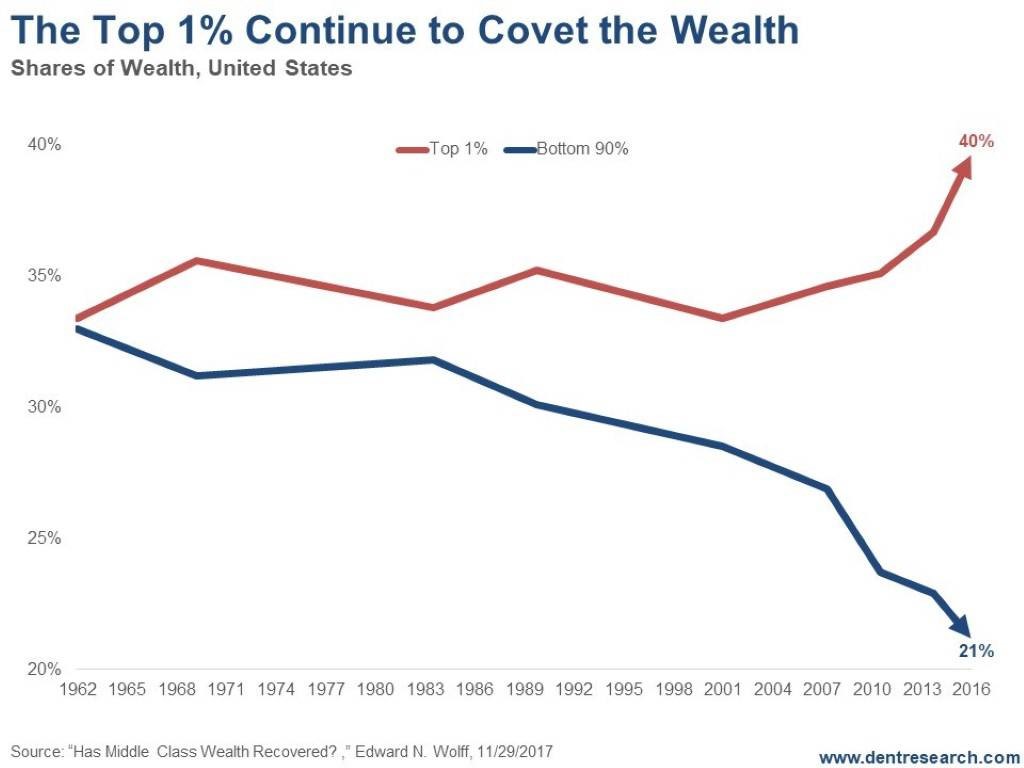
I just received an email from David Stockman's newsletter, and it included the upper graph taken from Edward N. Wolff's "Has Middle Class Wealth Recovered." There are a number of ways to look at the question of rich versus poor; the above graph uses one, the relative shares of the top one percent and the bottom ninety percent. (Disclaimer: I'm one of the nine percent in neither category.)
The gap narrows in the 1970s, but observe the lower graph, which is of real wage growth. Real wages stopped growing in 1973. The reason the wealth inequality declines during the 1970s in the upper graph is that the stock market was falling in the 1970s. Hence, the decline in wealth inequality during the 1970s is a measure of joint pain and only of theoretical importance. The solution put forward by Richard M. Nixon in 1971 was pumping money into the economy via the Federal Reserve Bank.
The gap narrows in the 1970s, but observe the lower graph, which is of real wage growth. Real wages stopped growing in 1973. The reason the wealth inequality declines during the 1970s in the upper graph is that the stock market was falling in the 1970s. Hence, the decline in wealth inequality during the 1970s is a measure of joint pain and only of theoretical importance. The solution put forward by Richard M. Nixon in 1971 was pumping money into the economy via the Federal Reserve Bank.
The pure paper money system established in 1971 helped the wealthy but not the majority. Notice also that the third-most-rapid increase in wealth inequality, according to the upper graph, occurred during the Reagan administration. It began to solidify during the Bush I years, 1988-1992; it remained constant during the Clinton years; then, following the tech bubble bust of 2001 it escalated during the Bush II years, which were the years of the second-greatest gains in wealth inequality. However, Bush and Reagan were pikers compared to Obama, who oversaw the most massive wealth transfers, which followed the 2008 crisis via the expansion of the Federal Reserve's balance sheet, the creation of massive amounts of reserve IOUs called Federal Reserve bank credit, quantitative easing, and so on.
The lower graph tells a slightly different story. Since the early 1970s, when the Fed was given a free hand to redistribute wealth via the creation of paper money, real wages have stagnated. The GDP has continued to grow, although the meaning of GDP is questionable because it includes government spending and make-work projects that do not create value. There is little difference between Democrats and Republicans.


No comments:
Post a Comment